Organizations utilize various business intelligence tools to derive data-driven insights for informed decision-making. These powerful tools enable businesses to gain a competitive edge, drive innovation, reduce risk, and improve overall business performance. One such tool is Power BI implementation. It’s a highly user-friendly self-service analytics and visualization tool that helps organizations extract data from multiple diverse sources and derive meaningful insights from it. Additionally, Power BI offers a comprehensive solution that can easily connect with various software tools, including CRM development and ERP.
However, to effectively leverage the tools to access, manage, and visualize your entire database of information, you must have a successful Power BI implementation services. The question is, how do you do that? In this blog, we’ll share a critical Power BI implementation roadmap to help you have a seamless rollout. In addition, we’ll also discuss a few of the mistakes you must avoid to make data-backed decisions with confidence.
Understanding Power BI & Its Components
According to Microsoft, Power BI is a “collection of software services, apps, and connectors that work together to help you create, share, and consume business insights in the way that serves you and your business most effectively.” In other words, as a data visualisation platform, Power BI transforms your raw data into coherent, visually immersive, and interactive insights.
Additionally, the BI platform was designed as “low-code tools” to help businesses leverage data analytics services. This means businesses can analyse and visualise data, design business solutions, and automate processes with minimal or no code writing.
Power BI in Action: Solving Everyday Business Hurdles
Power BI is a game-changer for businesses grappling with data chaos and decision-making delays. But to utilize Power BI services for business, organizations need to overcome a few hurdles. Here are 5 common business challenges it tackles head-on:
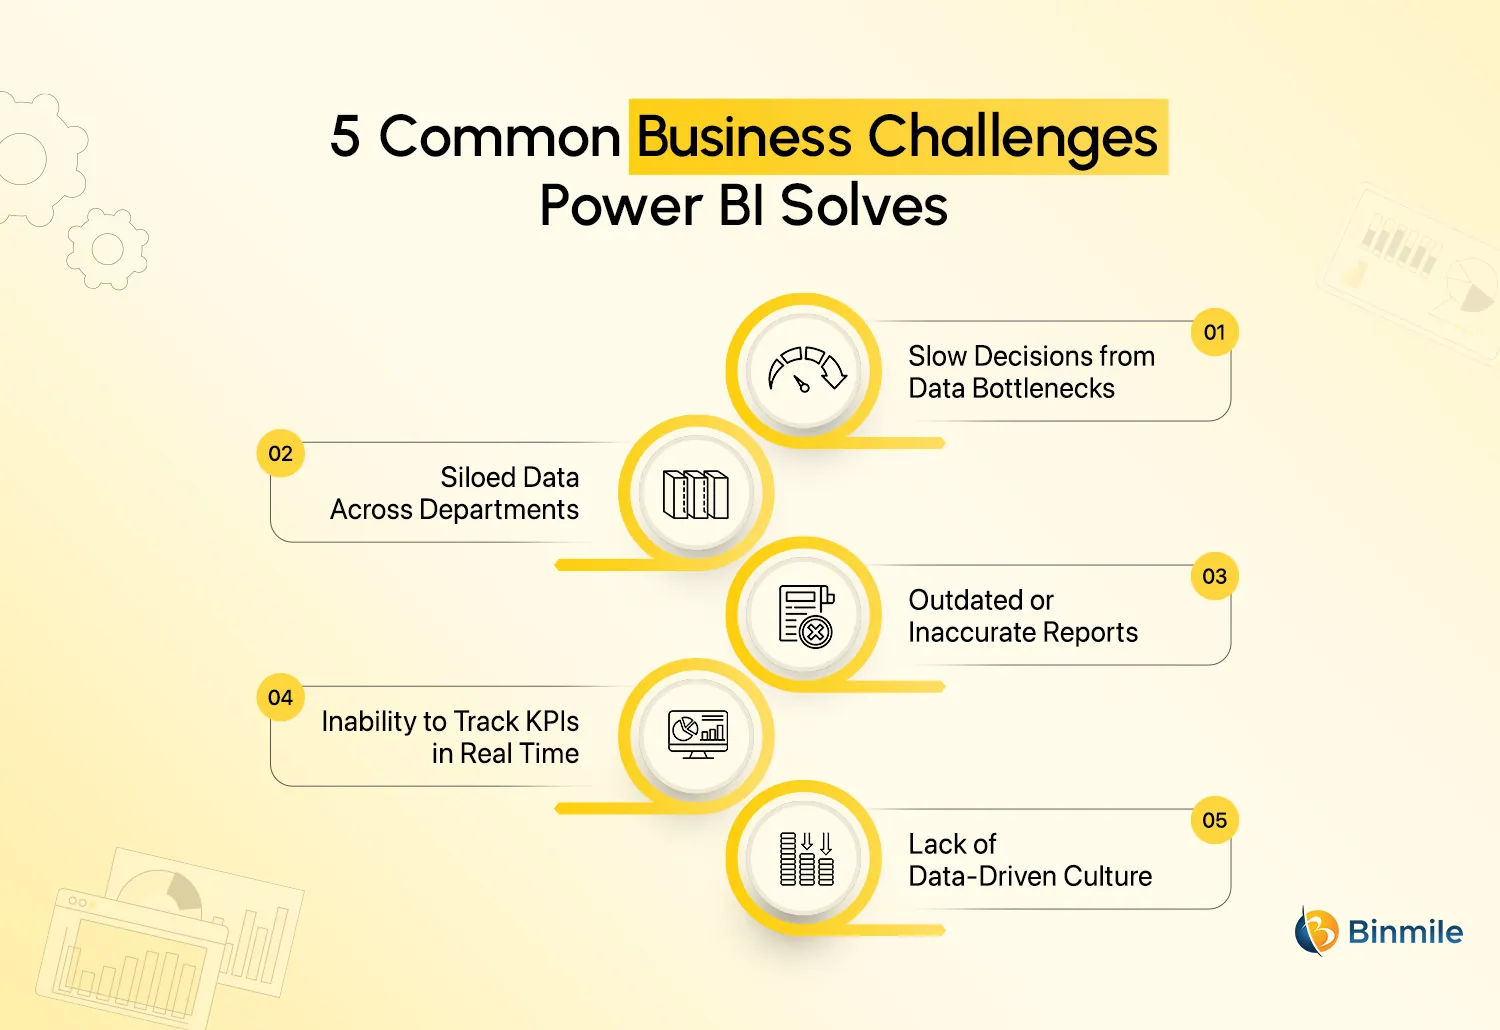
- Slow Decisions from Data Bottlenecks: Waiting for reports from various departments can hinder critical decisions. Power BI enables real-time dashboards and automated data refreshes, so leaders always have up-to-date insights at their fingertips.
- Siloed Data Across Departments: Gathering data from multiple sources, such as finance, sales, and operations, can be a nightmare. Power BI consolidates this into a single, interactive dashboard, streamlining cross-functional analysis.
- Outdated or Inaccurate Reports: Relying on static PDFs or stale spreadsheets can lead to poor decisions. Power BI ensures reports are dynamic, current, and based on live data connections.
- Inability to Track KPIs in Real Time: Without live metrics, businesses act reactively. Power BI provides real-time KPI dashboards, enabling the quick detection of issues and informed decision-making.
- Lack of Data-Driven Culture: When insights are hard to access, teams rely on gut instinct. Power BI democratizes data by making it accessible and understandable for everyone, from analysts to executives.
Also Read: Power BI Managed Services for Data Analysis
Power BI Implementation Roadmap: Step-by-Step Instructions for a Seamless Deployment
Power BI implementation services require a thoughtful blend of strategic planning, data discipline, and scalable processes. In this guide, we’ll cover each phase, providing a clear Power BI implementation roadmap from initial data preparation through to ongoing system sustainability.
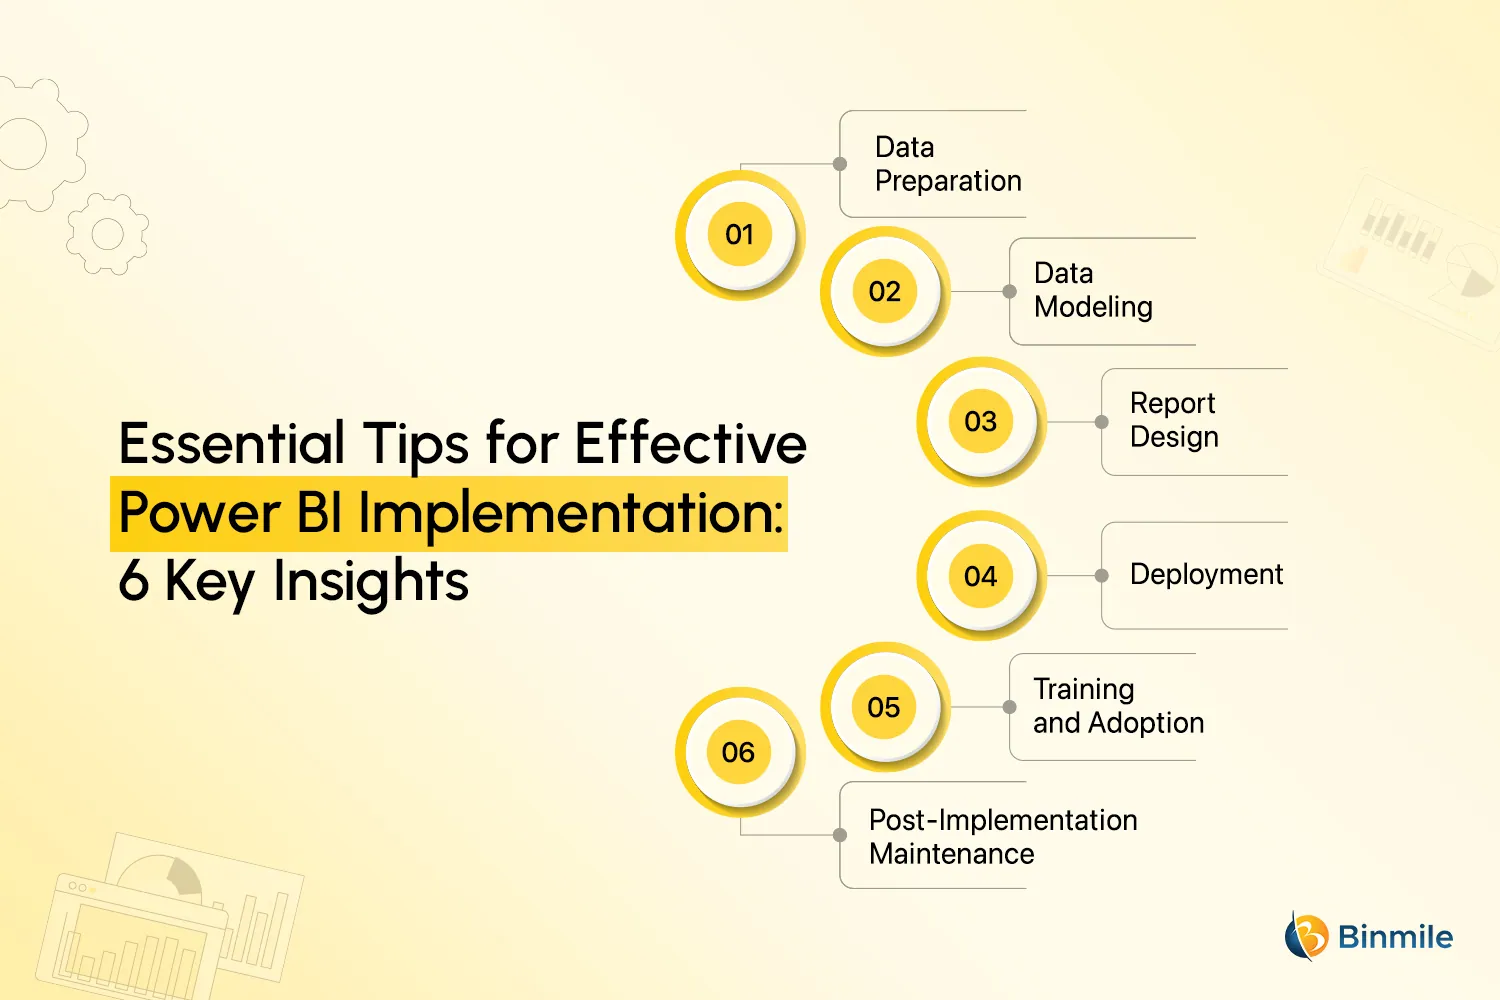
1. Data Preparation
Clean, reliable data is the most critical foundation for any BI system. Without it, every report downstream is at risk of misinterpretation or failure. This phase ensures your data is accurate, structured, and analysis-ready.
- Identify key data sources, including spreadsheets, APIs, and databases. Many organizations connect Power BI to SQL Server to streamline access to core structured data.
- Use profiling tools and validation checks to examine completeness, accuracy, and consistency at the source level.
- Leverage Power Query or third-party tools to create scalable ETL workflows that automate data cleansing and transformation.
- Define clear policies around access, versioning, and compliance to ensure long-term data integrity.
2. Data Modeling
A well-structured data model defines the user experience and decides user adoption. In regulated sectors like healthcare Power BI modeling must balance granular insights with strict privacy requirements. Therefore, clear relationships and scalable architecture make it easier to deliver fast, reliable insights as needs grow.
- Employ star or snowflake schemas to clearly separate fact and dimension tables, enabling faster query execution and intuitive analysis.
- Configure relationships with appropriate cardinality, keys, and filter directions to preserve calculation accuracy.
- Use DAX (Data Analysis Expressions, a library of functions and operators that can be used to build formulas and expressions) to encode business logic into reusable calculations aligned with organizational goals.
- Implement strategies such as indexing, data reduction, and aggregations to ensure scalability and responsiveness.
3. Report Design
Visual design plays a critical role in how insights are interpreted. Thoughtful visual choices and straightforward navigation directly impact adoption and decision-making. The goal is to design reports that not only aesthetically align with your brand but also functionally support decision-making.
- Choose the most appropriate chart types based on the nature of your data and the insights you’re aiming to highlight.
- Structure report pages with logical flows, clear hierarchies, and Power BI interactive dashboards features such as drill-throughs and tooltips.
- Apply organizational standards for colors, fonts, and logos to reinforce brand identity across all assets.
- Design for responsiveness, load efficiency, and cross-device compatibility to support varied user environments.
4. Deployment
With deployment, you’re not only publishing a report, you also create the entire framework required to ensure secure, reliable, and maintainable access across the organization. A strategic deployment plan ensures your Power BI environment remains sustainable, governed, and responsive to change.
- Organize content by teams, departments, or functions to enable role-based access and governance.
- Security Configuration: Implement row-level security and integrate with enterprise identity systems such as Azure AD to manage permissions at scale.
- Set up secure data gateways to enable scheduled refreshes from on-premises or hybrid sources without compromising infrastructure.
- Define formal publishing workflows, including app creation and audience segmentation, to streamline the delivery process.
5. Training and Adoption
Technology adoption doesn’t happen automatically. It requires structured enablement, role-specific learning, and cultural support. Training equips users with confidence and clarity, ensuring your investment translates into tangible, day-to-day decision-making impact.
- Segment training programs by role analysts, executives, and end-users, so each group learns what’s most relevant to them.
- Encourage hands-on sessions using organizational data to reinforce concepts in real-world scenarios.
- Maintain a living repository of user guides, video tutorials, and FAQs to reduce dependence on technical teams.
- Build feedback loops, identify internal champions, and communicate updates consistently to promote adoption.
6. Post-Implementation Maintenance
Sustaining a data culture in Power BI requires ongoing support, feedback loops, and governance to ensure insights remain relevant and trusted. All these aspects maintain the accuracy, performance, and alignment of Power BI with evolving business needs.
- Track usage metrics, query load times, and refresh schedules to preemptively address performance concerns.
- Maintain robust scheduling and alerting mechanisms to ensure timely data updates across all reports.
- Implement structured processes for managing report iterations, change reviews, and controlled releases to ensure consistency and efficiency.
- Establish a helpdesk or support team to manage requests, resolve issues, and track feedback for future enhancements.
Struggling with unstructured data? Make smarter, faster business decisions with a custom Power BI setup. Our experts help you deploy, integrate, and scale with ease.

5 Critical Mistakes to Avoid for Successful Power BI Implementation
For an effective Power BI implementation, you must avoid inevitable mistakes. What are they? We’re discussing a few of them that you should avoid in a successful deployment and maximize the potential of Power BIs:

1: Overcomplicated Reports
Designing complex dashboards with numerous charts, colors, and data points can confuse the user, rather than providing a clear understanding of the data. These complexities further discourage user engagement and complicate decision-making, instead of simplifying them.
2: Ignoring User Feedback
Failing to proactively collect, analyze, and execute user feedback in both development stages and after deployment. Such a mismatch between what developers assume and what users actually require leads to the creation of reports that fail to address the real business needs.
3: Skipping Documentation
Failure to develop detailed documentation of data sources, the calculations, functionality of reports, and user guides. The lack of oversight can make maintenance challenging, leaving knowledge silos within the organization that can hinder the long-term success of the Power BI systems.
4: Poor Data Quality Management
Deploying Power BI without setting up adequate data validation, cleansing, and quality control procedures. “Garbage in, garbage out” must be directly applied to BI systems, as ineffective data management tools lead to inaccurate insights, undermine user trust, and decline user adoption.
5: Inadequate Security Planning
Rushing deployment without proper configurations of row-level security, workspace access, and data access privileges. Neglected security practices can expose confidential information to unauthorized users, resulting in a severe infringement of compliance. This not only causes financial damage to the organization but also reputational damage.
Turn raw data into a refined asset. From ingestion to transformation, our data engineering services enable smarter systems and sharper decisions.

In Summary: Power BI Implementation Guide
We’ve explored the structured approach required for Power BI implementation—from preparing and modeling data to designing reports, enabling secure deployment, fostering adoption, and ensuring long-term sustainability. In this blog, we discussed how, at its core, Power BI is more than a reporting tool. It’s a strategic asset that, when implemented thoughtfully, can enhance decision-making, streamline operations, and unify data-driven thinking across the organization. Additionally, we examined how organizations frequently encounter challenges, including poor data quality, limited adoption, and governance gaps. Alongside these challenges, understanding the cost of Power BI and aligning it with organizational needs is essential. To tackle these issues effectively, businesses must focus on establishing strong data foundations, enabling users, and implementing effective governance.
If you also want to transform Power BI into a dynamic tool that not only answers business questions but also anticipates them, consider seeking a leading MS Dynamics 365 consulting services company. The organizations specialize in enterprise-grade Power BI implementation services tailored to your business context. From data architecture to dashboard delivery, they can help you get access to actionable insights that drive measurable outcomes and ensure that your business maximizes its potential.
Partner with us to turn your data into a competitive advantage. Reach out today to begin your Power BI transformation journey!