Companies are starting to realize how important data strategy is to their success. By embracing this culture wholeheartedly, businesses can unlock the limitless capability of Microsoft Power BI and move forward with a clear edge over their competitors.
In this blog, we will delve into the profound significance of data culture, exploring its deep importance, what it truly entails, and the multitude of benefits that accompany a robust data-driven mindset. Additionally, we will also examine how custom product development solutions can be incorporated to further amplify the advantages of a data culture within enterprises.
The Importance of Data Culture in Enterprises
To begin with, for businesses to do well in the digital age, they must adopt a data culture that permeates every part of their processes. Data culture is the way of thinking, habits, and values of a company that makes data-driven decision-making a priority and encourages employees to use data in their jobs. In fact, it’s more than just collecting and analyzing data; it’s also about making a place where data is respected, shared, and used to drive growth and innovation.

Defining Data Culture
In simple words, data culture means that everyone in a company, at every level, is committed to making decisions based on data. It means making sure workers know how important data is, actively looking for insights, and using them to guide their actions. However, a strong data culture encourages openness, collaboration, and accountability. Above all. this makes sure that choices are based on facts, not guesses or gut feelings.
Benefits of Cultivating a Data Culture
Creating a strong data culture has many benefits for businesses:
Decision-Making
First, it helps people make decisions based on facts. When data is at the center of decision-making processes, companies can make more accurate and objective choices, reducing the risks that come with gut feelings or biased judgments. This means better results, more speed, and less money spent.
Encouraging Innovation
Second, a data mindset encourages new ideas. By letting workers explore and play with data, companies create an environment that encourages creativity and helps people come up with new ideas. Data-driven insights can help find new business prospects, find out what customers want, and improve products or services, giving businesses an edge in the market.
Fostering Collaboration and Knowledge Sharing
Likewise, a strong data culture also makes it easier for people in a business to work together. When workers share data, insights, and analyses, they break down silos and make it easier for people from different departments to work together. Besides, by encouraging open conversation and sharing of knowledge, businesses can use the collective intelligence of their employees to solve problems better, streamline processes, and increase productivity.
Empowering Individuals
In essence, a data culture gives workers a sense of being in control. When people have access to relevant data and the tools to analyze it, they feel like they have the power to take responsibility for their work and make choices based on the data. This gives them more confidence, makes them happier at work, and gets them more involved in general. On the whole, this makes for a more focused and productive workforce.
Enhancing Adaptability and Resilience
All things considered, a data culture helps people be flexible and strong. In a business world that changes quickly, companies need to be flexible and quick to adapt. By embracing data culture, companies can quickly spot new trends, change their strategies, and stay ahead of the competition. Data-driven insights give you the clarity and foresight you need to deal with uncertainty and take advantage of chances.
Microsoft Power BI: An Overview
Microsoft Power BI is a powerful business intelligence and analytics tool that lets businesses turn raw data into meaningful insights. More often than not, power BI has become a popular choice for product engineering companies who want to use the power of data because it is easy to use and has a lot of features.
Let’s look at the most important parts of Power BI and how it can be used with other programs.
Key Features of Microsoft Power BI
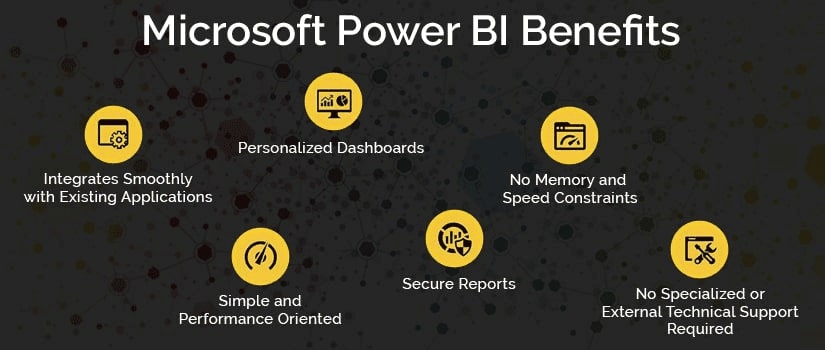
Power BI has a wide range of features made to meet the different needs of businesses. First of all, it has a wide range of ways to connect to data sources. Users can connect to databases, cloud services, Excel files, and more. Because of this, organizations can combine data from different platforms and get a central view of how their business is running.
Second, Power BI has powerful tools for modeling data. Users can change and shape data with a simple drag-and-drop interface, which makes it easy for them to get data ready for research. Also, Power BI’s advanced query editor lets users do complicated calculations and changes to data, making sure that the data is clean, correct, and ready to be visualized.
Integration Capabilities
Power BI works well with other Microsoft products and services as well as applications from other companies. With this connection, businesses can use the technology they’ve already invested in to get more out of Power BI. As an illustration, Microsoft Power BI works with Azure services, which lets businesses use advanced analytics, machine learning, and big data. On the whole, it also works with Microsoft Office 365, so users can add Power BI dashboards and reports to known programs like Excel and SharePoint.
Driving Data-Driven Decision-Making
Mainly, power BI is an important part of how businesses make decisions based on data. Its powerful data visualization tools let users make reports and panels that are both interactive and visually appealing. Pertaining to a wide range of images that can be changed and interactive features, users can easily look at data, find trends, and learn useful things. These ideas can be shared with stakeholders, making it easier for them to work together to make decisions.
Harnessing the Power of Data Visualization

As a matter of fact, data visualization is one of Power BI’s best features. Through charts, graphs, maps, and gauges, complicated data can be shown in a way that is clear and easy to understand. Users can change how visualizations look, add filters, and drill down into details to find hidden patterns and connections. The ability to turn raw data into visually appealing images improves understanding, makes it easier to tell a story, and helps stakeholders get key insights quickly.
Real-Time Analytics and Reporting

One of the best things about Power BI is that it can do analytics and reports in real-time. This is to say, with DirectQuery and Live Connection, users of Power BI can connect to real-time data sources and see changes as they happen. This gives businesses the ability to keep an eye on business metrics, track performance, and act quickly when things change. Moreover, real-time analytics and reporting help organizations make decisions quickly, so they can stay flexible and take advantage of new possibilities.
Empowering Enterprises with Microsoft Power BI
Given the above points, power BI does more than just offer powerful data and visualization tools. It also has better tools for data control and security, more ways to work together and share information, and best practices for a successful rollout.

Enhanced Data Governance and Security
Power BI puts data policy and security at the top of its list of priorities. This makes sure that businesses have control over their data assets. Administrators can set up and enforce data access rules, permissions, and roles. This makes sure that only authorized people can see private information.
Altogether, power BI also lets you encrypt data, both when it is at rest and when it is in motion. As a matter of fact, to protect the integrity of the data. These improved governance and security features give businesses peace of mind. Making sure they meet legal requirements and prevent data breaches.
Collaboration and Sharing Capabilities
It facilitates collaboration and knowledge sharing within an organization. Users can easily share reports, dashboards, and insights with colleagues, teams, and stakeholders. Its collaborative workspace, known as Power BI service or Power BI online, allows users to co-author reports, leave comments, and engage in discussions. By and large, this collaborative environment fosters a culture of knowledge exchange. Nonetheless, enabling teams to work together more effectively and make collective data-driven decisions.
Best Practices for Implementing Microsoft Power BI in Your Organization
- Developing a Data Strategy: Successful implementation of Power BI requires a thoughtful approach and adherence to best practices. Developing a data strategy is crucial, as it helps define organizational goals, identify key metrics, and establish data governance frameworks. As written above, a well-defined data strategy aligns Power BI implementation with business objectives. Consequently, ensuring that the right data is captured, analyzed, and visualized. It also enables enterprises to prioritize data sources, determine data quality requirements, and establish data refresh schedules.
- User Training and Adoption: User training and adoption are equally important for maximizing the value of Power BI. Training programs should be designed to empower users with the necessary skills to navigate Power BI’s features. Simply, to create compelling visualizations, and interpret data effectively. Subsequently, ongoing training and support enable users to become proficient in leveraging Power BI’s capabilities. Further, fostering a data-driven culture within the organization. Additionally, promoting user adoption through internal marketing, demonstrations, and success stories encourages widespread usage and acceptance of Power BI as a critical business tool.
Also Read: Connect Power BI to SQL Server
The Bottom Line
In summary, Microsoft Power BI empowers businesses with improved data governance and security. It facilitates collaboration and seamless information sharing. Additionally, Power BI offers best practices for successful implementation. With Power BI, businesses can make data-driven decisions, enhance collaboration, and unleash the full potential of their data assets—all while maintaining control over the cost of Power BI, which remains a critical factor in enterprise adoption.
However, to fully leverage the potential of Power BI, businesses must prioritize key factors. These include developing a robust data strategy, investing in training and adoption, and fostering a culture of continuous improvement. Moreover, with Power BI as a strategic partner, businesses gain valuable insights. Also, maintain competitiveness, and make informed choices to thrive in the data-driven landscape.
Do you want to make your data work for you? Do you want your business to benefit from machine learning and artificial intelligence?
Our Microsoft consulting services are sure to help transform your data into business insights. We help you figure out how to get the most out of Microsoft Dynamics 365. So on and so forth, so that your business runs more smoothly. Broadly speaking, we make Microsoft Dynamics 365 easy to use so it can meet the needs of your business.