
Data drives organizations, having been recently declared the “new oil” of the digital economy. After all, data has huge potential to bring value to your business, making its accrual and the analysis of it, aka data science, very promising. However, there are two issues that businesses face at large. One, data is being generated and evolving at lightning speed, making data management a complex process. Secondly, data management is already considered complex and is often seen as tedious, expensive, and time-consuming. As it can get in the way of the digital transformation initiatives of an organization, C-suite executives and CIOs should strive to identify ways to tackle data management complexity effectively.
Enter Artificial Intelligence or AI innovations in dashboards. Imagine having a data expert by your side who creates a personalized dashboard to showcase the most crucial insights. That’s how AI-driven dashboards are transforming data management for CIOs! In this blog, we’ll discuss the impact of AI on data management, specifically how it empowers CIOs to make data-driven decisions with greater speed and efficiency. Additionally, we’ll also share tips on how to truly create lasting value with data, with a solid data management strategy on AI-driven dashboards.
Overcoming Data Overload: The Role of AI in CIO’s Dashboard Management

CIOs or C-suite executives deal with a lot of data while managing the IT ecosystem or during legacy system modernization of the organizations. This puts them against a cluster of information presented within the dashboard, making it challenging to extract meaningful insights. This gets overwhelming in the traditional dashboards that display raw data without clear connections to business outcomes. Therefore, with no clear context and actionable insights, this can hinder effective decision-making.
However, AI-driven dashboards boost CIO efforts to deliver insights and predictions that allow them to utilize organizational resources that cater to business processes and growth goals. Thus, this helps them redirect their efforts and resources to the highest-value projects. For CIOs, specific dashboards that focus on IT assets and granular cost data are essential for prioritizing effectively and linking IT spending to business impact.
Also Read: Artificial Intelligence Vs Intelligence Automation
5 Ways AI-driven Dashboards Streamline Data Management for CIOs
Not just CIOs but also other C-suite leaders play a pivotal role in harnessing data’s power and extracting meaning out of huge amounts of raw data with the help of dashboards. The advanced tools offered by AI lead to unparalleled insights and efficiency. However, it does more and now we’ll discuss them.
#1 Real-Time Data Insights
With the application of advanced algorithms, these dashboards process and provide insights from complex data sources thus enabling them to make decisions in real-time. It doesn’t matter whether you are tracking KPIs, identifying anomalies, or discovering emerging trends, the CIO’s understanding of real-time data helps him to tread the jagged digital path with high precision and speed.
#2 Predictive Analytics
Utilizing AI software solutions with dashboards offers predicting analytics options to CIOs that strengthen their ability to forecast future trends. Through analyzing historical evidence gathered by machine learning algorithms, future scenarios can be determined as well as ways to counter them in advance. Given the accuracy and efficiency of the predictive analytics, CIOs have at their fingertips, the organizations will be able to move towards success steadily with confidence and foresight.
#3 Automated Data Integration
These dashboards can streamline data management with the help of smart data pipelines and gather information from different systems and applications with varied data sources. Having the capability to integrate these data streams seamlessly, CIOs obtain a unified view of their organization’s data ecosystem, thus, increasing their operational efficiency and the accuracy of the data.
#4 Personalized Data Visualization
Customizable data visualization features enable CIOs to design their dashboards in line with their particular wants and requirements. AI-driven tools are designed to give CIOs the visual representation of data in the form of interactive charts and graphs, intuitive dashboards that make the data meaningful and understandable to their decision-making framework.
#5 Enhanced Security and Compliance
With the encrypted protocols and the security-authentication mechanisms, these AI-driven dashboards ensure that the data is secured during its entire life cycle. Moreover, AI algorithms can detect anomalies and potential security threats in real-time, enabling proactive measures to mitigate AI risks, prevent security breaches, and maintain regulatory compliance.
Read More: Data Modernization Role in Digital Transformation
So, are you ready to embrace the power of AI and transform your data management strategy? Ring us now!
How to Use AI for Data Visualizations and Dashboards: 7 Key Insights
Developing a solid AI-driven dashboard is more than throwing data and AI on the target where they stick. So, let’s explore 7 major steps to build a solid strategy to leverage AI for data management:
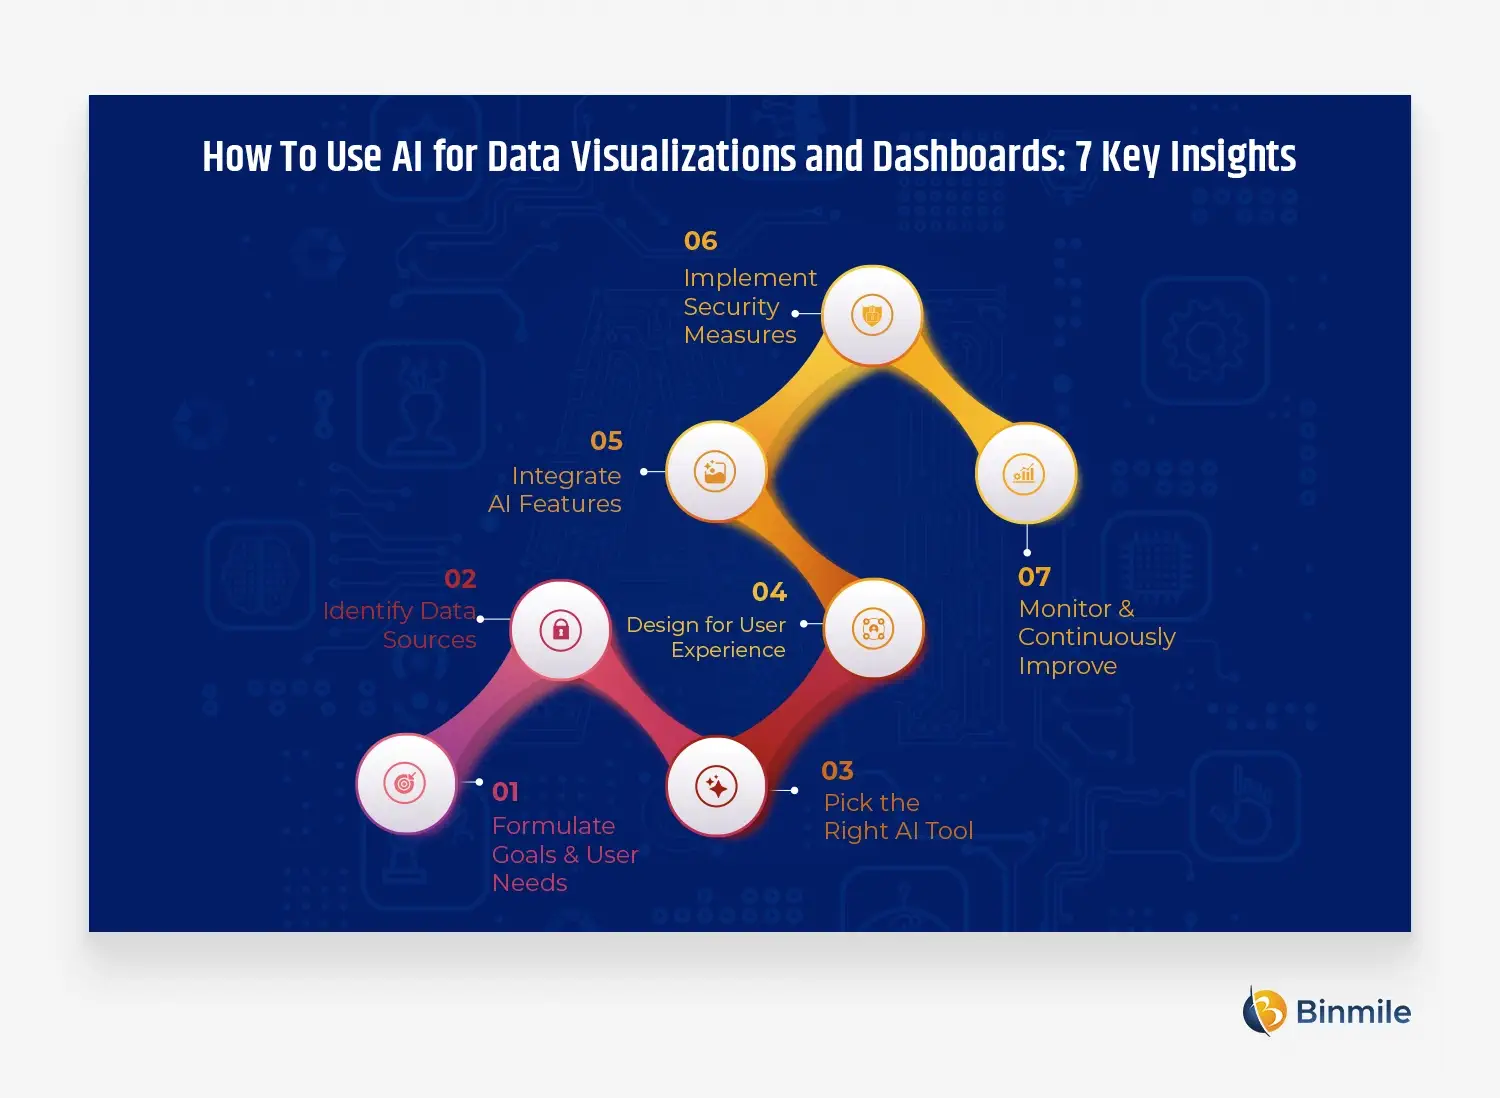
1. Formulate Goals & User Needs
Establish clear goals and decide the most essential goals of the dashboard you want to accomplish. Who is the end user (e.g. department or management)? Doing so, at the beginning of the development helps you represent the information you need, is relevant, and is catered to the targeted audience.
2. Identify Data Sources
A dashboard would be incomplete without data. Carefully evaluate the data that you’ll insert into your AI dashboard. Include elements such as internal databases, CRM tools, customer feedback surveys, or social feeds. Ensure data quality and consistency across the sources of data to have accurate results and reliable input.
3. Pick the Right AI Tool
The AI tool collection process is so immense and complex that it tends to be overwhelming. Go for AI automation tools that suit the functionalities of your dashboard. For example, if we need anomaly detection, seek tools with pattern recognition and outlier identification agendas.
4. Design for User Experience
To create an attractive and intuitive user interface is the key priority. Try to concentrate on effective visualizations that resonate with your target audience. Think about working with extra elements like drill-down menus or clickable charts to enable users to visualize data in the most detailed way.
5. Integrate AI Features
Effortlessly integrate AI functionalities into the system. Focus on features such as anomaly identification and predictive models. This transforms the dashboard into an intelligent partner, by providing a comprehensive platform for insights, suggestions, and analysis.
6. Implement Security Measures
There’s a lot that depends on your data and its security should be paramount when building AI-powered dashboards. You must ensure the AI tools and dashboard platform you select have robust security measures such as data encryption, access controls, and regular security audits in place.
7. Monitor & Continuously Improve
Regularly monitor dashboard usage via website analytics or user feedback surveys. It lets you identify areas for improvement and iterate on the design and functionalities based on user needs. Remember, your organization’s data evolves, and so should your AI-powered dashboard.
Know More: Enhance Business Growth with AI Customer Experience
Wrapping Up
We have learned so far how AI is transforming business intelligence dashboards from static reporting to dynamic, proactive decision support systems. From automated anomaly detection to real-time insights, AI streamlines data management surfaces critical trends and empowers informed decision-making. The result? A simplified CIO dashboard that provides a clear view of your organization’s health, allowing you to navigate the competitive landscape with confidence.
However, to fully utilize an AI dashboard, one must understand its key features and benefits of it. Hopefully, this blog has offered a detailed overview of what AI is in the dashboard and what changes it brings to the business. If you feel overwhelmed by the efforts, you can always seek an AI development services company. It can augment your efforts to understand the deep insight of business activities and decision-making processes for maximum returns in terms of business value.
Frequently Asked Questions
AI-powered dashboards leverage machine learning algorithms to analyze large datasets and provide insights that would be difficult or time-consuming to obtain manually. This includes:
- Predictive analytics: AI can forecast future trends and identify potential risks.
- Anomaly detection: AI can detect unusual patterns in data, indicating potential issues or security threats.
- Natural language processing: AI can enable users to interact with dashboards using natural language, making them more accessible.
- Automated reporting: AI can generate customized reports based on user preferences and data requirements.
When selecting a CIO dashboard tool, it is important to consider the following factors:
- Functionality: Ensure that the tool meets your specific needs and provides the features you require.
- Scalability: The tool should be able to handle your organization’s current and future data volumes.
- Integration: The tool should be able to integrate with your existing IT infrastructure.
- Cost: Consider the cost of the tool, including licensing fees and maintenance costs.
- Ease of use: The tool should be easy to use, even for non-technical users.
AI-powered dashboards can be used for a variety of purposes, including:
- IT performance monitoring: Tracking key metrics such as server uptime, network utilization, and application response times.
- Security threat detection: Identifying and responding to security incidents in real-time.
- Cost optimization: Analyzing IT spending and identifying areas for cost savings.
- Capacity planning: Forecasting future IT resource needs and ensuring adequate capacity.


