When it comes to finding the best tool among the widely used BI tools, i.e., Power BI vs. Tableau vs. Looker, Power BI stands out the most with rich visualizations. It offers a suite of advanced analytics that helps translate data into actionable decisions. These advanced data analytics in Power BI help businesses to make informed decisions for their benefit. However, setting up, maintaining, and optimizing Power BI with these advanced analytics is a real struggle if you are not an expert.
Many businesses juggle with fragmented reports and data quality, resulting in delayed insights and inefficiencies in data management & operations. This is why getting Power BI managed services from external data engineering experts is in your best interest.
The Power BI managed services help businesses get a deeper insight, resulting in improved data-driven decisions. Managed analytics services benefit businesses as they reduce data operation risks and enhance the scalability and efficiency of data science services. So, what are these managed analytics services, and how to leverage them for advanced analytics? This blog will provide a clearer understanding of these managed services, their top analytic features, and how to perform advanced analytics for your business.
Why Choose Power BI Managed Services?
Power BI or Microsoft Power BI is an impactful tool for data analysis and visualization, providing a suite of software services, apps, and connectors. It is a strategic platform that empowers various industries such as healthcare, finance, logistics, marketing, operations, etc. It offers immersive data analytics using core components such as Power Query, Power Pivot, Power BI desktop, Power BI service, etc. Instead of spending hours on implementing Power BI, organizations should work with Power BI service providers that have deeper expertise.
With Power BI managed services, businesses can outsource their data needs and have access to a wide range of end-to-end data analytics services. From creating a structured data model and developing advanced analytics features to optimizing the performance and complying with data governance protocols, these services support an organization’s data lifecycle throughout. These managed analytics services help organizations leverage powerful analytics capabilities for driving scalability and providing informed business insights.
Also Read: How to Connect Power BI to SQL Server
How can Advanced Analytics in Power BI Help Businesses?
Advanced analytics provides data insights that go beyond traditional business intelligence, with the help of machine learning (ML) and innovative visualization techniques. Microsoft Power BI is one of the most powerful platforms that incorporate advanced analytics features, providing modern business capabilities like data analysis, visualization, and reporting. These capabilities help organizations to improve their data processing methods and strategies. This helps them to track their performance across cross-functional teams and enables better, informed decisions.
With advanced analytics in Power BI, businesses can optimize their operations, as it enables them to:
- Power BI managed services help organizations to identify and predict future outcomes, helping them make more proactive decisions to eliminate any risks that can occur.
- They provide deeper data insights and help you understand the correlation between various data variables and their functions.
- Using these managed analytics, organizations can better understand their customer’s behavior and specific needs, which helps in developing products that directly resonate with the target audience.
For data-driven growth, introducing outsourced Power BI managed services in systems helps businesses enhance their accuracy without even creating and managing their own analytics infrastructure.
Key Advanced Analytics Features in Power BI
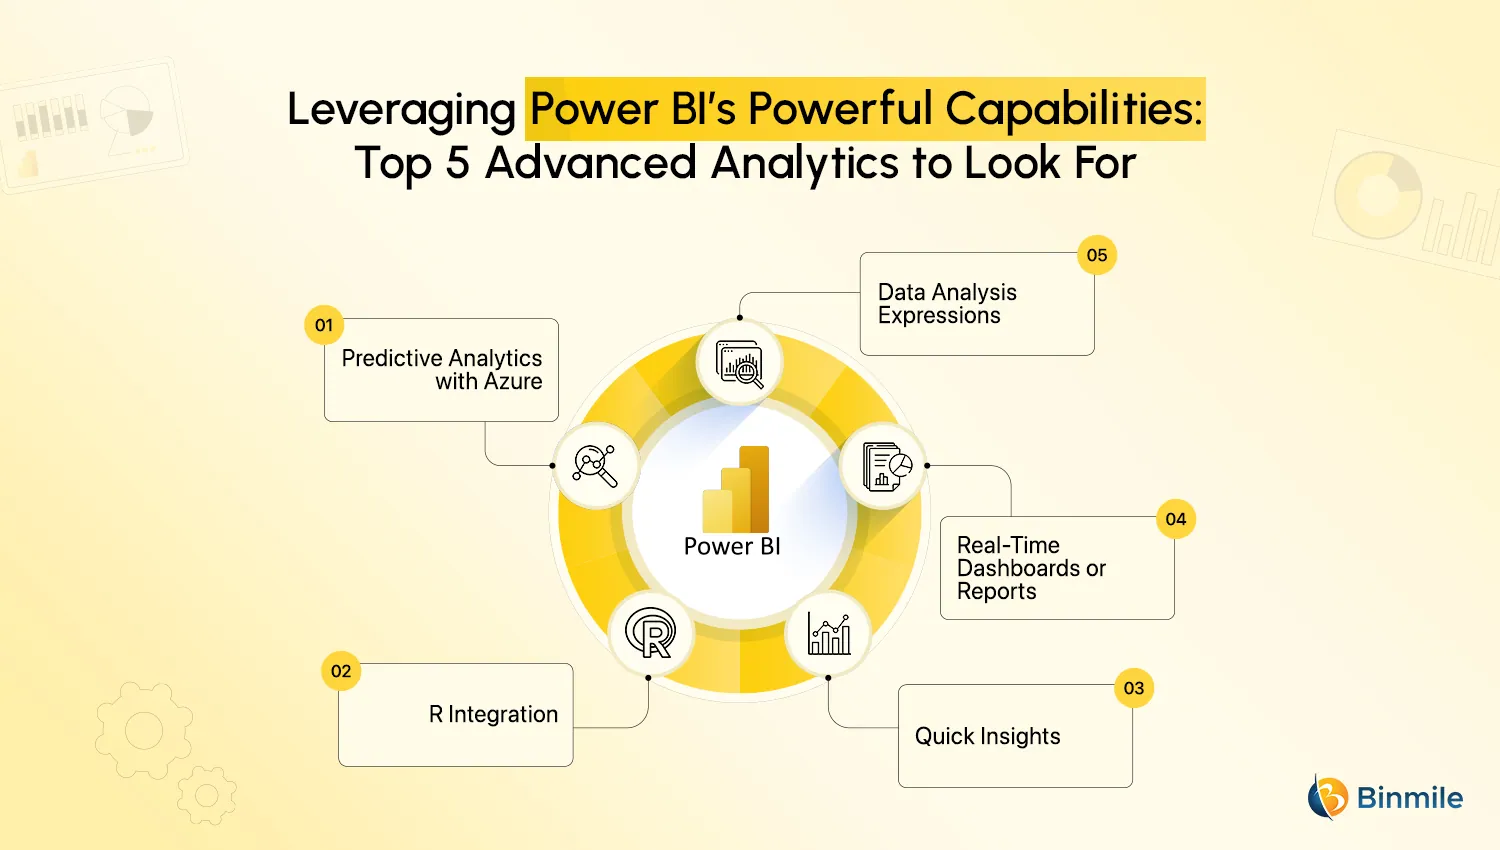
1: Predictive Analytics with Azure
Predictive analytics helps teams make dedicated decisions by providing the ability to identify patterns and risks using real-time and historical data. Power BI brings this powerful predictive capability that can help teams create predictive models with the help of machine learning and Azure Machine Learning Studio.
Azure provides new data science capabilities and offers support to various skill-level developers, such as no-code authoring beginners and code-first experienced developers. It enables teams to build, train, optimize, and deploy predictive machine learning models, which can be well-integrated into Power BI report systems or dashboards. Machine learning algorithms provide the capability for teams to quickly create predictive models by dragging, dropping, and connecting some data modules. This capability helps them visualize these models to know future outcomes.
2: R Integration
R is a programming language that is used for statistical computing, in which data is represented in graphical visualizations to increase the data’s interactivity level. Power BI’s powerful suite of apps can be well integrated with the R language for custom visualization and advanced computation strategies. Within Power BI, this language can perform statistical analysis and can incorporate the results into Power BI’s dashboards or reports. This overall process is known as R integration.
Using R with the Power Query feature, Power BI can perform advanced data cleansing tasks on raw data, like detecting anomalies or handling missing values. This completed raw data is now a useful asset and can be converted into automated ETL (Extract, Transform, and Load) workflows. This R integration capability helps in the removal of data silos and the implementation of scalable Power BI data cleansing methods.
3: Quick Insights
The Quick Insights feature uses a collection of powerful and advanced analytical algorithms, which were developed in collaboration with the Microsoft Research team. This feature can generate data insights on an entire semantic model with the help of new and intuitive automation methods, like identifying trends and analyzing anomalies.
With the help of the quick insights feature, Power BI can search and scan subsets of the chosen datasets within a particular timeframe. Using complex algorithms, this feature automatically provides information about missing anomalies or suspicious patterns, helping teams to work on that particular dataset. Also, performing discovery tasks with Power BI, such as uncovering hidden trends and identifying relationships between two datasets, can be more efficient now.
4: Real-Time Dashboards or Reports
Handling, displaying, and analyzing real-time data can be a daunting task for businesses, as the datasets are complex and constantly changing with the evolving requirements of business goals. With the creation of real-time dashboards, teams can monitor their datasets as soon as they get live or updated. Interactive dashboards can help transform the data into immersive visuals, which help teams gain regular and instant analysis of sensitive or financial information.
With the minimum cost setup, Power BI creates a sample dashboard, enabling teams to add features like IoT sensor readouts or edit any filter and essential categories. This feature allows you to have knowledge of extensive datasets and improve the usability of these data assets by accessing real-time reports.
5: Data Analysis Expressions
Data Analysis Expressions (commonly referred to as DAX) is a powerful language that encapsulates capabilities to create advanced and complex calculations on one or more values. These calculations are done on data metrics with the help of a formula or expression, enabling teams to perform custom calculations and deep dive into insights from the calculations done on the data.
DAX formulas are effective for solving real-time business problems with easy integration in Power BI. Teams need to manipulate data based on their specific data analysis and visualization needs. They can define custom logic on variables, functions, operators, and constants. This increases accuracy in future data projections and helps you leverage dynamic data.
For deploying and managing the Power BI setup, utilize impactful Power BI’s advanced analytics—connect today to unlock data-informed decisions.
How to Perform Advanced Analytics in Power BI?
Leveraging and performing advanced analytics in Power BI involves some steps discussed below.
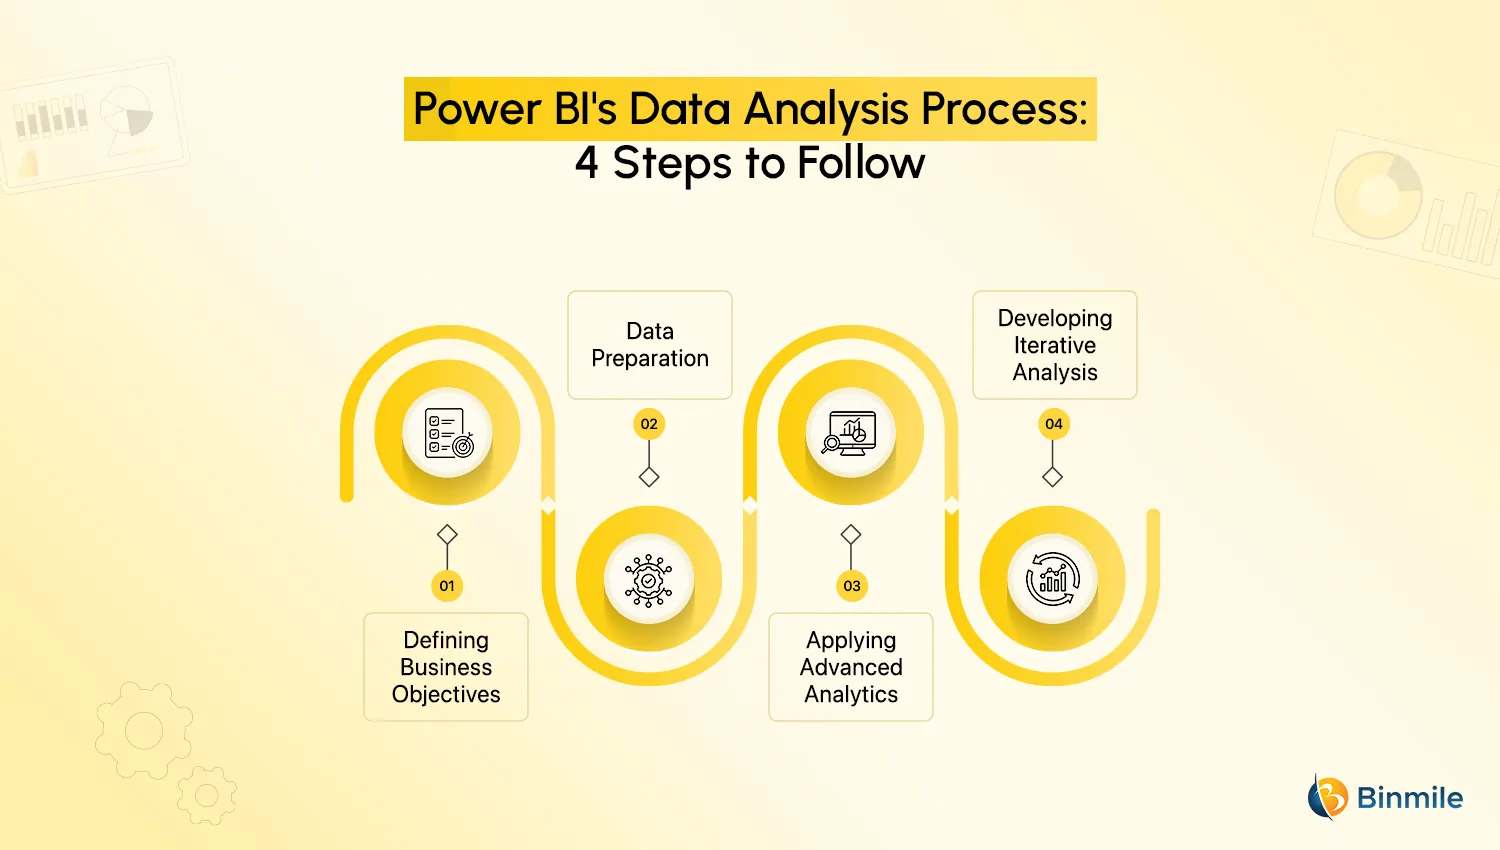
- Defining Business Objectives: For clear implementation of the entire analysis process, businesses should structure their end goal and specific requirements. Also, building motivated and knowledgeable teams plays a crucial role here. This is because they should have a deeper understanding of data analysis and visualization to find insights from complex datasets.
- Data preparation: After defining some requirements, teams can now perform data analysis strategies on the raw data by cleaning and shaping it into valuable data assets. Here, teams can utilize the built-in automated Power Query for high-quality managed analytics services. This phase ensures that cleaning and transformation processes are automatically done.
- Applying Advanced Analytics: This phase involves strategically applying advanced analytics, which we have discussed earlier. In order to apply the best advanced analytic features in Power BI, teams have to research and know whether they want to identify new trends, make predictions, or uncover potential bugs in data patterns. Using these advanced insights, teams can create dashboards or report visualizations that are interactive and effectively present the results of a particular analysis.
- Developing Iterative Analysis: With the help of deeper insights, teams can now change their managed analysis strategies by continuously reiterating and updating them. These transformative data insights enable teams to leverage and collaborate with Power BI’s features. This allows them to seamlessly integrate some collaborative and innovative features, resulting in improved data accuracy and decision-making strategies.
Want to optimize raw datasets with data-driven analytic strategies, enabling businesses to have smarter data analysis systems?
Closing Remarks on Leveraging Power BI Managed Services
Leveraging Power BI managed services with advanced analytics empowers organizations to make their data processes more efficient and productive with data-driven insights. These services foster a more streamlined data analysis process and provide accuracy through advanced analytics such as predictive modeling, R integration, quick insights, real-time dashboards, and DAX (data analysis expressions). However, incorporating these managed services using Power BI with the correct advanced analytics feature completely depends on aligning the business needs. Businesses need to clearly understand and research what data analytics processes can ensure their long-term success and data consistency.
In this blog, we have explored the top 5 advanced analytics features in Power BI and how to perform these using 4 easy steps. Partnering with a software development company that provides data analytics services can help you choose the right analytics feature for your organization, enabling you to drive efficiency.